Automatic Analysis#
Building on previous research, we can identify consistent features present in every analysis, allowing us to create an automated tool for decoding all instructions. These key features include:
Three Dispatcher Functions: These include two switch statements and one highly obfuscated function, all of which are crucial for identifying opcode handling.
Data Reading Pattern: Before any instruction handler executes its logic, all necessary data is read first. This means that by identifying where specific fields, such as the hash value or hash data length, are located, we can recreate the instruction format ID. For example, if the hash value is read from offset
0x08, we can infer that one variable is taken from the stack (since4 + 4 = 0x08). The full structure of the instruction format is outlined in the previous section.Entry Point and Opcode Encoding: These differ across versions, adding another layer of complexity to the analysis.
Using these characteristics, we can attempt to create a system capable of decoding instructions across different versions of pairipcore. The first and most crucial abstraction involves the opcode and entry point encoding. The Python package for this project defines two function types specifically for these purposes:
OpcodeDecoderFn     = Callable[[int], opcode_t] # fn(int) -> opcode_t
EntryPointDecoderFn = Callable[[VM], addr_t]    # fn(VM) -> addr_t
These functions must be provided when creating the interpreter for the current instruction set:
from pairipcore import VM, decode_opcode_v0, decode_entry_point_v0

code: bytes = ...
vm = VM(code, decode_opcode_v0, decode_entry_point_v0)
It’s important to note that there won’t be an all-in-one Python script available for download at the end of this chapter. The results discussed here are still in development and are not yet ready for public release.
Collecting Opcode Handlers#
Since most of the opcode handlers are implemented via switch statements, we can leverage Ghidra’s API to enumerate them. In Ghidra, all children of a switch statement are represented as symbols, so we can directly identify the code address of each handler function.
_defaul_cases: set[int] = ...
_case_addresses: set[int] = ...
for case_symbol_id in switch_cases:
  # get symbol from Ghidra's SymbolTable
  symbol = symbol_table.getSymbol(case_symbol_id)

  # we also know that there are default cases in both switch statements,
  # so we have to keep track of all cases to distinguish them. Default
  # cases will be present more than one time in _case_addresses
  addr = symbol.getAddress()
  addr__int = Address_ToInt(addr)
  if addr__int in _case_addresses:
    _default_cases.append(addr__int)

  # opcode number can be extracted from symbol name
  opcode = int(symbol.getName().replace("caseD_", ""), 16)
After collecting the addresses of all opcode handlers, we can deduce that the first switch statement corresponds to the first dispatcher function, referred to as vm_dispatch_0, and the second switch statement is associated with vm_dispatch_2.
Re-creating Instruction Formats#
To accurately reverse-engineer instruction formats, we can leverage the repetitive structure found in each instruction handler. Typically, these handlers perform a sequence of operations, such as:
Loading the VMContext into a register.
Loading the program counter (
pc) into a register.Reading all instructino variables
Instead of manually tracking every access to vm_context->vmCode, we focus on inspecting
each integer addition to the pc. These additions often contain the offsets that reveal
how the instruction reads from the compiled stack or memory.
To gather all the necessary offset positions within instructions, we can utilize Ghidra’s Pcode representation. Pcode is an intermediate representation that can help in understanding the low-level operations being performed. By analyzing the Pcode for each instruction handler, we can extract the offsets involved in operations such as loading and storing variables.
for op in decomp_result.getHighFunction().getPcodeOps():
  mnemonic = op.getMnemonic()
  match mnemonic:
    case "BRANCH":
      # Stop after first brach expression as we know there won't be any variables
      # read from the stream afterwards
      break
    case "INT_ADD":
      # output must be a register and inputs[1] must be the offset
      inputs = op.getInputs()
      output = op.getOutput()
      if inputs[1].isConstant() and output.isRegister():
        offset = inputs[1].getAddress().getOffset()
        # we can infer the offset position of the instruction info as
        # soon as we detect the hash value
        if offset - _prev_offset == 0x08:
          _info_begin = _prev_offset

        _prev_offset = offset
        struct_offsets.append(offset)
Once we have identified the offsets, we can calculate:
The number of variables taken from the compiled stack.
The number of extra variables loaded by the instruction.
Unfortunately, certain details, like the exact store variable or the specific operation being performed, may remain unknown without deeper analysis or additional context. This limitation means that while we can identify many aspects of the instruction format, some elements might still require further investigation or heuristics to determine accurately.
stack_vars = len(list(filter(lambda x: x < _info_begin, struct_offsets)))
extra_vars = len(list(filter(lambda x: x >= _info_begin + 26, struct_offsets)))

# Use 'x' to mark the format id with an unknown result variable
format_id = f"{stack_vars}{extra_vars}x"
By utilizing the techniques discussed so far, the script can successfully collect and re-create
approximately 90 out of the 159 (0x9F possible) opcodes. However, there remains a
challenge: the remaining handlers are stored within a function called vm_dispatch_1,
which is heavily obfuscated.
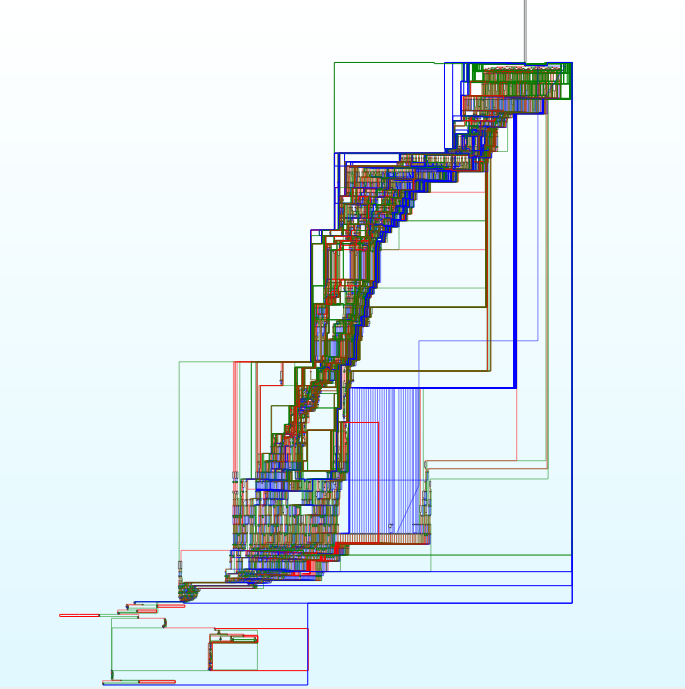
Function graph of vm_dispatch_1 using IDA (Free of course).#
How do we deal with this?#
The obfuscation present in vm_dispatch_1 significantly complicates analysis. This function likely employs various control flow flattening and data encoding techniques, making it difficult to understand and reverse-engineer directly. To tackle this:
Following States until tomorrow#
Several recent articles have explored methods for analyzing and de-obfuscating functions that employ a dispatcher pattern, similar to what is used here. Notable examples include works by Quarkslab, MODeflattener, and many more.
After experimenting with cea-sec/miasm for symbolic execution to trace the state machine within the function, it became apparent that the function was too large to be quickly analyzed this way.
Warning
The following section discusses a workaround that is not entirely stable and should be considered a somewhat crude method for retrieving some handlers.
nstead of relying on symbolic execution to trace the states within the function, the quickest workaround was to use tree-sitter/tree-sitter alongside the function’s source code (which spans roughly 16,000 lines each time). This approach is not bulletproof; it is merely intended to identify some of the missing handlers..
By leveraging tree-sitter’s querying capabilities, we can search for all state assignments and collect potential state variables. We know that these assignments appear as simple if-statements in Ghidra, which allows us to locate them efficiently:
tsq_state_assignment = C.query("""\
(assignment_expression
    left: (identifier)
    right: (number_literal)
) @assign
""")

for _, match_data in tsq_state_assignment.matches(body):
  node = match_data["assign"]
  # the first state:
  condition_state_1 = node.child_by_field_name("right").text

  # We know the next (named) node must be an if-statement according
  # to Ghidra's C representation.
  if_statement = node.parent.next_named_sibling
  # --- additional checks excluded here ---

  condition = if_statement.child_by_field_name("condition")
  # The condition contains the opcode we are loooking for and the
  # operation (one of '!=' and '<')
  opcode = ...
  operation = ...
  # the 'consequence' of the if-statement includes the other state
  # variable assignment
Using the scheme outlined earlier, we can extract opcodes and their potential handler state variables into a mapping between opcode and state variable. This mapping can then be used to identify the if-statement that corresponds to each opcode’s state variable:
state__if_query = C.query(f"""\
(
    (if_statement
        condition: (parenthesized_expression
            (binary_expression
                left: (identifier)
                right: (number_literal) @state-var))) @if
    (#eq? @state-var "{potential_state_var}")
)
""")
If the matched if-statement includes an assignment in the following line, we can naively assume that a handler is located within the body of that if-statement. To accurately detect the offsets of each instruction format, we focus on the constant expressions found in each handler, particularly the pointer dereferences that Ghidra automatically generates.
tsq_insn_field = C.query("""\
(assignment_expression
left: (identifier)
right: (pointer_expression)
) @pc
""")

offset = 0
for _, data in tsq_insn_field.matches(if_statement_body):
  # The linw will take the following form:
  #   <variable> = *(<type> *)(...);
  # We only need the type to calculate the offset position
  line = data["pc"].text.decode().strip()
  match extract_type(line):
    case "uint" | "int" | "undefined4":
      struct_offsets.append(offset)
      offset += 4
    case "ushort" | "short" | "undefined2":
      struct_offsets.append(offset)
      offset += 4
      # Start can be calculated now
      _info_begin = offset - 0x0C
    case _:
      # all other variables must be treated as "long" (hash_value)
      _struct_offsets.append(_offset)
      _offset += 8
Of course, the code provided here is a simplified version and lacks certain checks, but it illustrates the general approach for extracting potential handler cases by tracking state variables. With this foundational understanding, we can develop an analysis script capable of automatically extracting all opcode format IDs.
Combining these techniques, the script successfully identifies 134 out of 155 instruction format IDs, which accounts for approximately 86% coverage. Furthermore, the addresses of all handler functions (or their corresponding lines in the case of vm_dispatch_1) are collected alongside the format IDs, allowing for more detailed subsequent analysis.
But is there any way to enhance this approach even further to identify all opcode handlers?
Bottom-Up: From Handlers to their States#
Identifying opcode handlers directly within the source code is significantly more straightforward when using Tree-Sitter, compared to the process of tracking each state. Therefore, an alternative approach is to first collect all potential handlers and then map them to their corresponding states.
Instead of relying on state tracing, we can efficiently locate all handlers by querying for pointer assignments where the first function parameter is used in the pointer expression. This allows us to gather all the relevant handler functions in one step.
tsq_handler_query = C.query("""\
(assignment_expression
    left: (identifier)
    right: (pointer_expression)) @handler
""")
After identifying the handler, the next step involves retrieving the associated code variable, typically loaded in the subsequent lines of the handler function. By leveraging this characteristic, we can pinpoint the code variable’s name and use it to build the format ID.
handler_node: Node = ...
context_var_name   = ts_assign_expr_left(handler_node)
code_var_node      = ts_get_code_var(handler_node, context_var_name)

# Finally, build the format ID by querying for assignment expressions
# The .parent attributes navigate out of the expression statement
# and into the compound statement containing the handler
tsq_assignment_query = C.query("""\
(assignment_expression
    left: (identifier)) @handler
""")
format_id = ts_build_format_id(
    tsq_assignment_query.matches(handler_node.parent.parent),
    code_var_node.starting_point[0], # get starting point
    code_var,
)
To retrieve the state variable, we analyze the enclosing if statement within the code. By applying this technique, the modified script successfully identifies all opcode handlers and assigns the corresponding format IDs to them.
A successful script execution should produce output resembling the following:
Starting Ghidra (Headless)...
Finished starting Ghidra
Importing on program at './libpairipcore.so'...
Finished analysis
Starting switch namespace lookup...
Finished namespace analysis:
  Found 0x9a switch cases with 2 default cases!
  > vm_dispatch_0 is at 0x00144e1f
  > vm_dispatch_1 is at 0x00129aa0
  > vm_dispatch_2 is at 0x0014d370
Decompiling pairipvm::VMDispatch1...
Finished decompiling
Opcode 0x02 at [00144f21, 0015ecfe] default=['0x144e1f', '0x15ecfe'] formatid='03x'
Opcode 0x05 at [001470bd, 0015ecfe] default=['0x144e1f', '0x15ecfe'] formatid='12x'
# -- snip --
Decompiling pairipvm::VMDispatch2...
Finished decompiling
Opcode 0x01 at [0014d3b9] default=['0x144e1f', '0x15ecfe'] formatid='02x'
# -- snip --
Analyzing case addresses...
Resolved 92 out of 154 opcodes so far!
Missing 62 out of 154 opcodes
Decompiling pairipvm::Dispatch1...
Finished decompilation
Analyzing ast source of pairipvm::Dispatch1...
Discovered 160 possible opcode handlers with 1 bogus state(s)!
Collected 60 additional opcode handlers!
Finished analysis:
  > Total   opcodes: 0x98
  > Missing opcodes: 0x0
The generated JSON file with all opcode definitions should look like this:
{
  "vm_dispatch_0": 282143, # absolute file offset to function start
  "vm_dispatch_1": 170656,
  "vm_dispatch_2": 316272,
  "opcodes": {
    "2": {
      "opcode": 2,
      "format_id": "03x",
      "addresses": [282401, 388350], # absolute file offset
      "code_line": null,             # only used in vm_dispatch_1
      "code_file": "vm_dispatch_0"
    },
    "5": {
      "opcode": 5,
      "format_id": "12x",
      "addresses": [291005, 388350],
      "code_line": null,
      "code_file": "vm_dispatch_0"
    },
    ...
  },
  "default_cases": [282143, 388350]
}